Modelling Tick Bite Risk
 featured.png
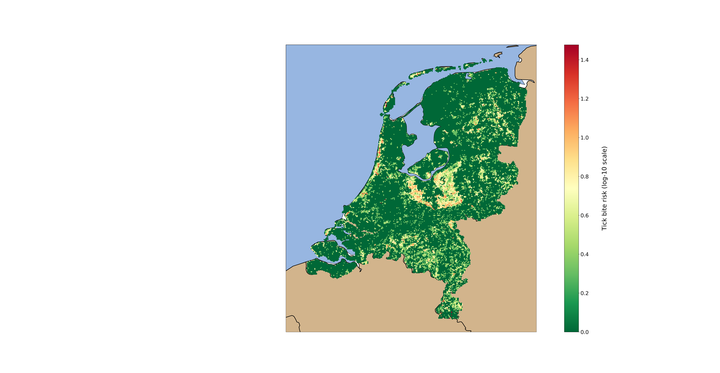
The fourth paper is currently under review for PLOS ONE, but you can read the pre-print in bioRxiv. In this work we basically take all the knowledge gained and the building blocks developed in the three previous publications to create a tick bite risk model. Let’s recap what we know so far:
- Risk (R):
- R can be estimated from the volunteered tick bites, which are a combination of H x E
- R seems to be more influenced by human factors than seasonal accumulations of weather variables
- Hazard (H):
- H can be estimated from the tick activity counts collected by volunteers in forested locations
- H seems to be driven by atmospheric water levels, rather than temperature
- Exposure (E):
- E levels are similar in unattractive suburban forest patches
- E levels are maximum along the edges of attractive forests and big natural areas
In the third publication we show how obtain a static map of human exposure as a combination of the other two components. However, by doing this we can visualize how the E looks like, but we don’t know about the drivers of this E and, most importantly, we can’t extract any knowledge to predict for regions with no data. This is where we put all pieces together. Given that we had a robust data-driven model predicting for H, and our tick bites collection, the R, had expanded until roughly 50,000 reports, we realized that a thorough characterization of the E component was the missing building block to build our tick bite risk model.
What attracts a citizen to nature? Well, the list of activities is endless, but the available geodata collections are not. So we collected as much relevant geodatasets as possible from the vast Dutch SDI catalogue PDOK.nl. We derived a series of 19 features classified in attractiveness and accessibility metrics. This means that for the location of each of the tick bite reports we calculated the distance to the closest forest, recreational area, camping, swimming spot, or local walking route, among others. We did this with the idea of providing some human exposure context to each of the volunteered reports.
Modelling this enriched tick bites collection required some data sciency additional skills. You can find a longer explanation in the paper, but long story short: canonical machine learning methods do not deal well with skewed and zero-inflated distributions. This was our case, since we had a huge number of locations in the country with zero or one tick bites, and very few locations with a high number of tick bites. Understanding how to solve this limitation using a Random Forest method for the modelling took some time, but finally we realized a solution. We combined random forest with statistical models of the exponential family, concretely Poisson and Negative Binomial (in its zero-inflated forms as well). These models learn naturally with skewed (and zero-inflated) distributions, so after random forest deals with the non-linearity of the data, the count data models will learn from the homogeneous samples falling in each leaf node.
Irene Garcia-Marti
PhD Data Scientist
I have a keen interest in applying machine learning methods in the field of spatio-temporal analytics.